 The latest data from the National Association of REALTORS® offers a nuanced look at the state of the U.S. housing market—and what it means for buyers, sellers, and REALTORS® alike. As market conditions evolve, staying informed allows you to better serve your clients and navigate your next transaction with confidence. Here’s what stood out in May’s report.
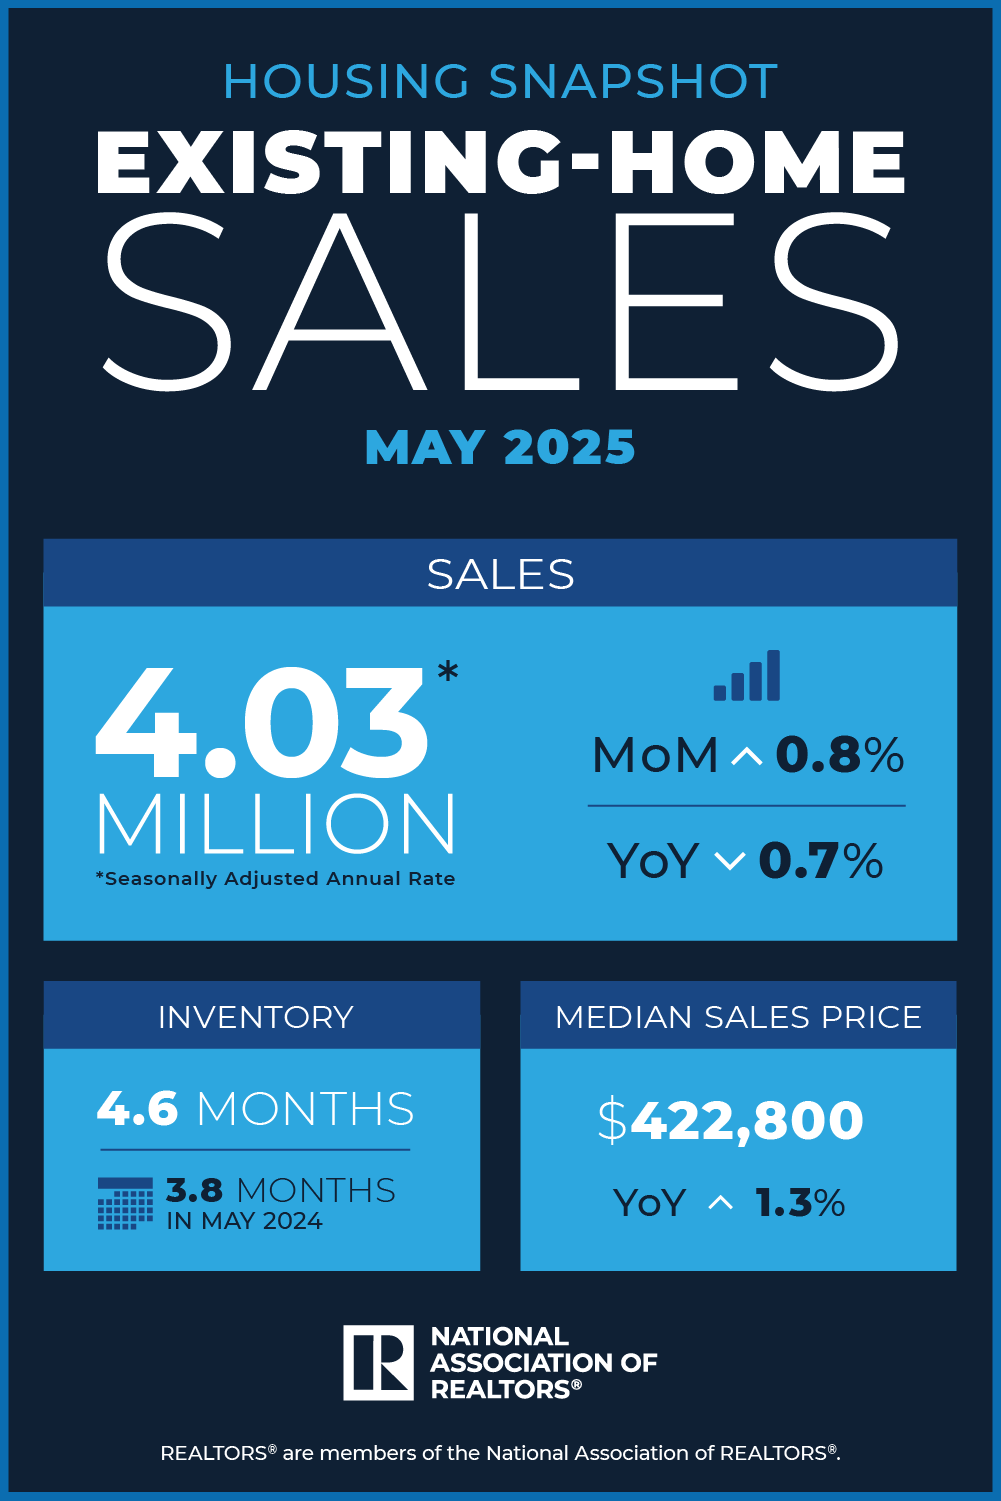
Sales Climb Month-Over-Month, but Remain Soft Year-Over-Year
- Existing-home sales rose 0.8% in May, reaching a seasonally adjusted annual rate (SAAR) of 4.03 million units.
- Despite this monthly gain, sales were down 0.7% compared to May 2024.
Economists attribute the muted overall pace to elevated mortgage rates. According to NAR Chief Economist Lawrence Yun, “Lower interest rates will attract more buyers and sellers to the housing market. Increasing participation will drive economic growth.”
Inventory Rises, Offering Relief for Buyers
- Total housing inventory climbed to 1.54 million units, a 6.2% jump from April and a notable 20.3% increase from one year ago.
- This translates to a 4.6-month supply—up from 3.8 months in May 2024.
This increase in inventory suggests a more favorable environment for buyers, with more options and slightly more breathing room in negotiations.
Median Home Prices Hit New Record for May
- The median existing-home price for all housing types was $422,800, up 1.3% year-over-year.
- This marks the 23rd consecutive month of year-over-year price growth and the highest May median on record.
Price gains varied by region and property type, but the overall trend points to continued upward pressure, fueled by strong income growth and limited supply in many areas.
By Property Type: Detached Homes Rise, Condos Lag
- Single-family home sales rose 1.1% from April and ticked up 0.3% year-over-year, with a median price of $427,800.
- In contrast, condo/co-op sales fell 2.7% month-over-month and are down 10% from last year, though prices still inched up to $371,300.
This divergence signals that demand remains stronger for standalone homes, possibly reflecting shifting buyer preferences.
Regional Breakdown: Northeast and Midwest Lead
- Northeast: +4.2% MoM sales gain; +4.2% YoY; $513,300 median price (+7.1% YoY)
- Midwest: +2.1% MoM; +1.0% YoY; $326,400 median price (+3.4%)
- South: +1.7% MoM; -0.5% YoY; $367,800 median price (-0.7%)
- West: -5.4% MoM; -6.7% YoY; $633,500 median price (+0.5%)
Notably, the Northeast and Midwest are showing strength, both in sales and price growth, while the West continues to struggle with higher costs and affordability constraints.
REALTORS® Confidence Index Highlights
- 27 days: Median time on market (down from 29 in April).
- 30% of sales were first-time buyers.
- 27% were cash sales.
- 17% were investor/second-home purchases.
- 3% of sales were distressed (foreclosures/short sales).
- 6.81%: Average 30-year fixed mortgage rate (as of June 18).
These metrics offer insight into the buyer profile and market dynamics, with cash sales and investor activity showing mild increases.
What This Means for NCJAR Members
As we enter the second half of 2025, REALTORS® should:
- Stay vigilant about mortgage rate trends—declining rates could open the floodgates for pent-up buyer demand.
- Encourage sellers to price strategically, especially in regions with rising inventory.
- Focus on educating first-time buyers, who remain active and need trusted guidance in today’s market.
- Use regional insights to tailor your approach—what works in Morris County may not apply in Sussex or Warren.
Stay tuned for future updates as we track the pulse of the market. For more resources to help you serve your clients and strengthen your business, visit facts.realtor.
